Loading speed is a crucial factor for any website owner, as a slow website can lead to a decrease in visitors and conversions. However, it can be challenging to determine your website’s current performance accurately.
Thankfully, there are numerous tools available that can help you measure your site’s loading time and even provide suggestions for improvement. By understanding how to interpret these WordPress site performance test results, you can identify and resolve performance issues before they become more significant.
This article will explain the significance of monitoring your WordPress website’s performance and provide three effective methods to measure it accurately. Furthermore, we will discuss ways to enhance your website’s performance based on the results from the WordPress site performance test obtained. Let’s dive in!
Why do you need to measure your WordPress website’s performance?
Website performance primarily refers to how quickly pages load. Slow-loading websites can negatively affect user experience, leading to higher bounce rates and lower conversion rates. With WordPress, there are several ways to optimize website performance, but the most critical decisions involve choosing a suitable web host and theme.
Some web hosts offer better performance than others, while some themes are faster than others. Therefore, making informed decisions in these areas is crucial. However, it’s still essential to monitor your site’s performance regularly to identify any issues and make improvements.
Checking your site’s performance once or twice a month is recommended, especially during unexpected traffic spikes. By doing so, you can ensure that your website is always performing well and delivering a positive user experience.
Best WordPress site performance test tools
Google Page Speed Insights
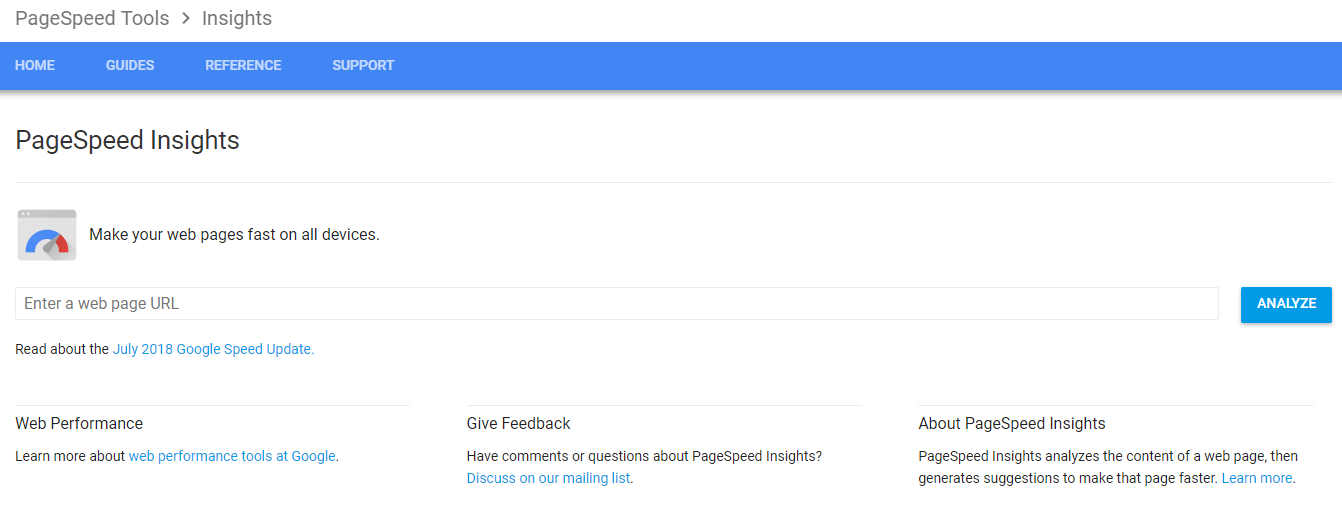
Google’s PageSpeed Insights is a powerful WordPress site performance test tool that evaluates website performance based on various parameters, including website speed, and provides a score for both the desktop and mobile versions. As mobile traffic to websites continues to increase, the score for the mobile version is particularly critical.
The tool presents the FCP (First Contentful Paint) score using a set of tri-color horizontal bars, indicating how long it takes for the website to display content on the screen. In the example given, 65% of the page content was loaded in under 1.1 seconds. The second bar represents DCL (DOMContentLoaded), indicating when the Document Object Model (DOM) is ready.
The tool also provides recommendations for optimizing user experience and improving results, such as optimizing images, minifying JS and CSS, and implementing browser caching.
GTmetrix
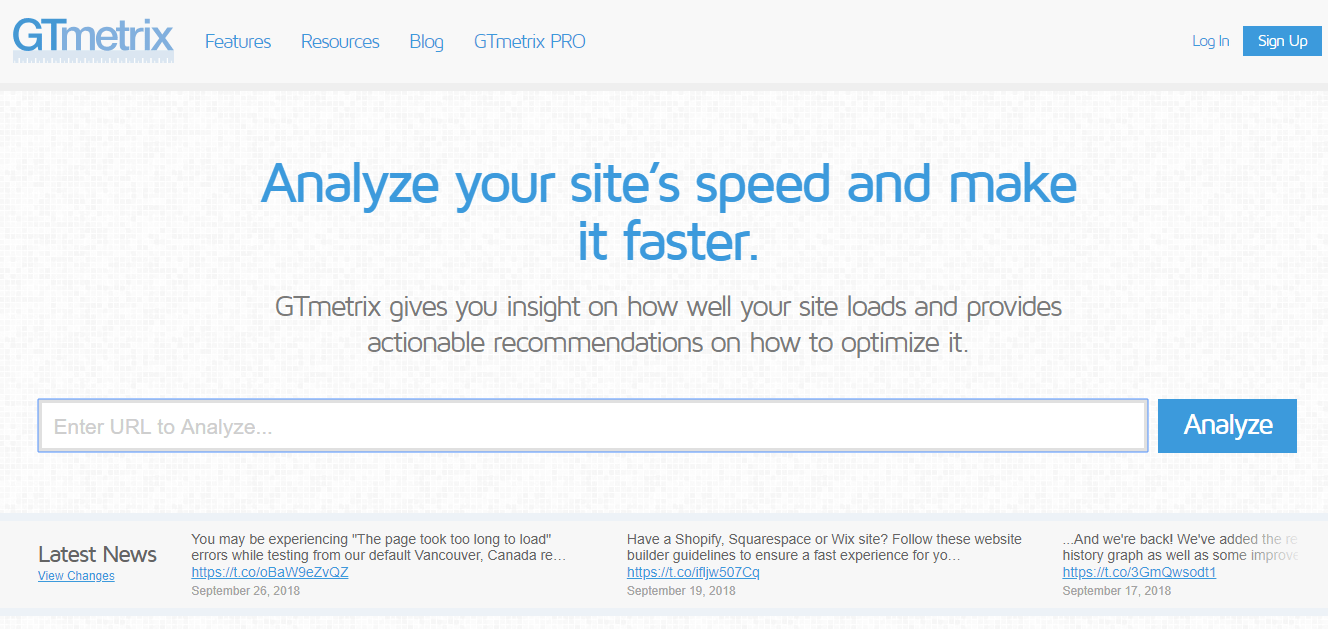
GTmetrix is a popular free WordPress site performance test tool for testing website speed and generating detailed performance reports, particularly in the WordPress community. By creating a free account, you can customize your testing options, such as choosing from seven available test server locations, selecting the type of browser and an internet connection, and unlocking several other features.
The scorecard of GTmetrix consists of two sections: top tabs and bottom list. The top tabs display the overall page speed score, YSlow Score, load time, page size, and number of requests. The bottom list provides detailed performance insights, which are divided into PageSpeed, YSlow, Waterfall, Timings, Video, and History tabs respectively.
The Waterfall tab displays a graphical representation of the loading time for each element on your website. You can also expand the element details for advanced diagnostics. The History tab shows previous results for the same website in a graphical format, including HTML/Page Load time graph, Page Sizes and Request Counts, and Page Speed and YSlow Scores.
GTmetrix also offers developers the option to integrate a RESTful API Web Testing Service into their development environment or application, with 20 daily API credits available. Additionally, load time testing can be automated at regular intervals for greater convenience.
Pingdom Tools
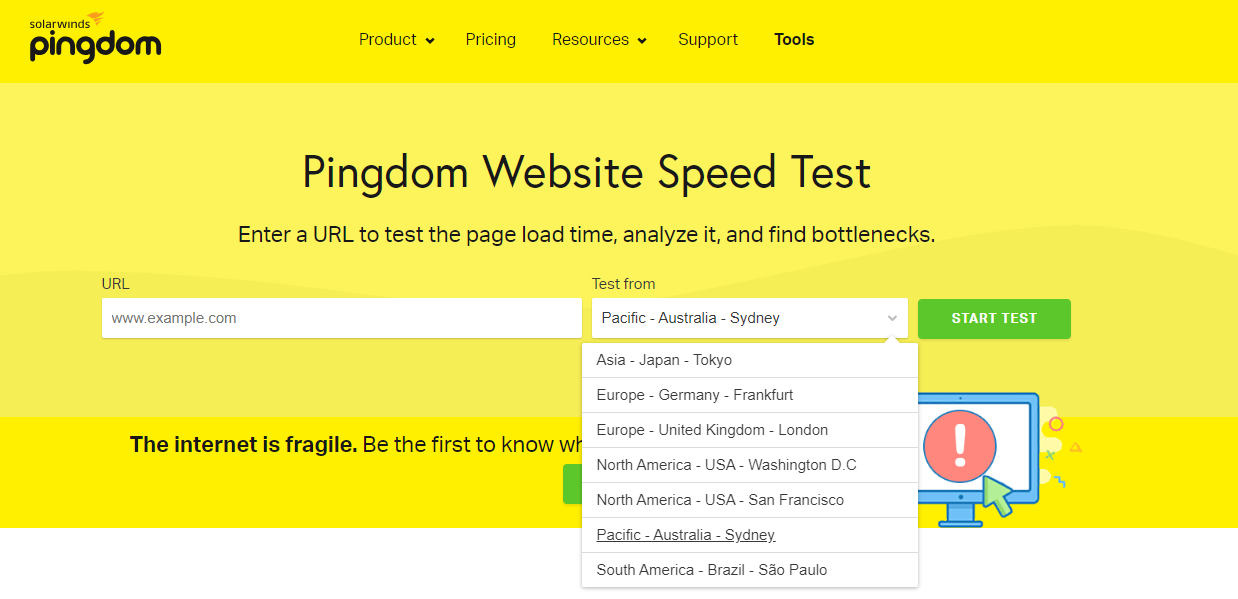
Pingdom Tools is a WordPress site performance test tool for checking website speed that allows you to choose from seven different server locations for testing. However, the lack of options for selecting a browser or connection speed is a significant disadvantage for free accounts.
This tool assigns a performance grade out of 100 to your website, along with load time and page size analysis. One unique feature of Pingdom Tools is that it shows you the percentile of your website’s performance compared to all other websites tested on the platform.
The waterfall display provides extensive details about each request header, and each element has expandable details available. Instead of using Page Speed or YSlow indicators, Pingdom Tools uses its metrics to measure website performance.
The Page Analysis tab is the most valuable feature of this tool, showing the time spent per state (wait, connect, receive, etc.), time spent per content type (image, script, HTML, etc.), and time spent per domain. This information can help identify page elements that add to the overall page load time.
In the History tab, you can also see graphs of Page Load Time, Page Size and Request Count, and Page Speed Score.
WebPageTest.org
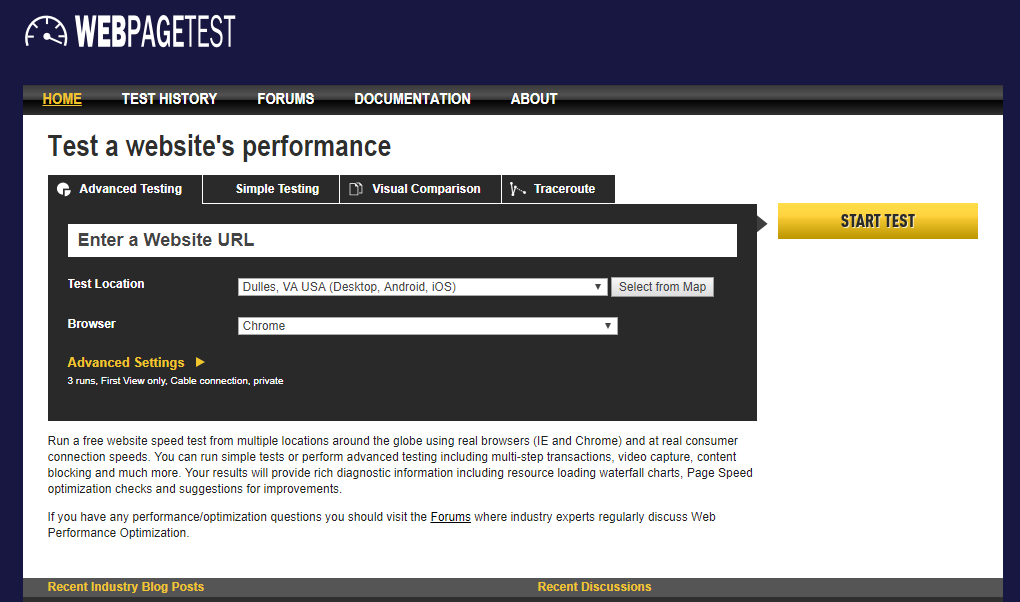
WebPageTest.org is a valuable tool for evaluating website speed and performance. this WordPress site performance test offers many location choices for test servers across North and South America, Europe, and Asia, and supports various browsers, including IE 11, Chrome, Canary, Firefox, and mobile devices for Android and iOS.
In addition to load time analysis, WebPageTest.org offers advanced settings, such as video rendering, network log capture, and custom scripting. It also provides grading on different parameters, including Time to First Byte, number of requests, and complete document loading time.
The waterfall view in WebPageTest.org is less detailed than in GTmetrix but makes up for it with other graphical features, such as a CPU utilization and bandwidth graph and a connection view that helps identity what contributes most to load time.
The Content Breakdown page presents a pie chart of your page’s composition by various elements. Overall, WebPageTest.org is a powerful tool for evaluating website speed and performance.
YSlow
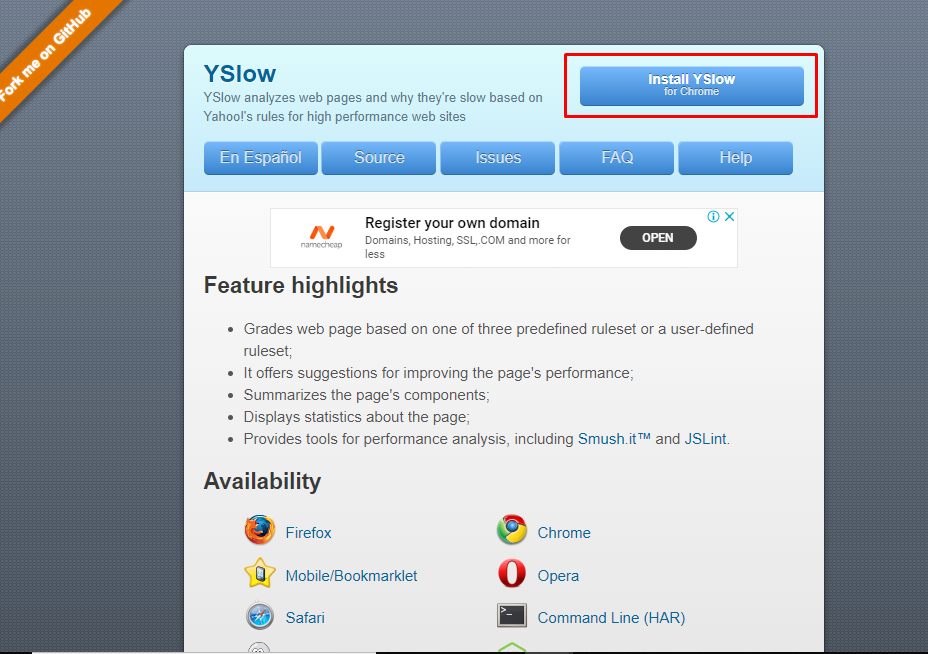
Just to clarify, YSlow does not offer direct website speed testing. Instead, it is a browser extension that analyzes web pages based on a set of 23 predefined rules that affect website performance. This WordPress site performance test tool generates a report card with suggestions to improve the website’s speed and performance based on these rules. The tool’s recommendations include optimizing images, using a content delivery network (CDN), minifying CSS and JavaScript files, and reducing HTTP requests. While YSlow does not offer a Waterfall feature, it does provide a detailed breakdown of the web page’s components and content, making it a useful tool for developers looking to optimize their websites.
New Relic
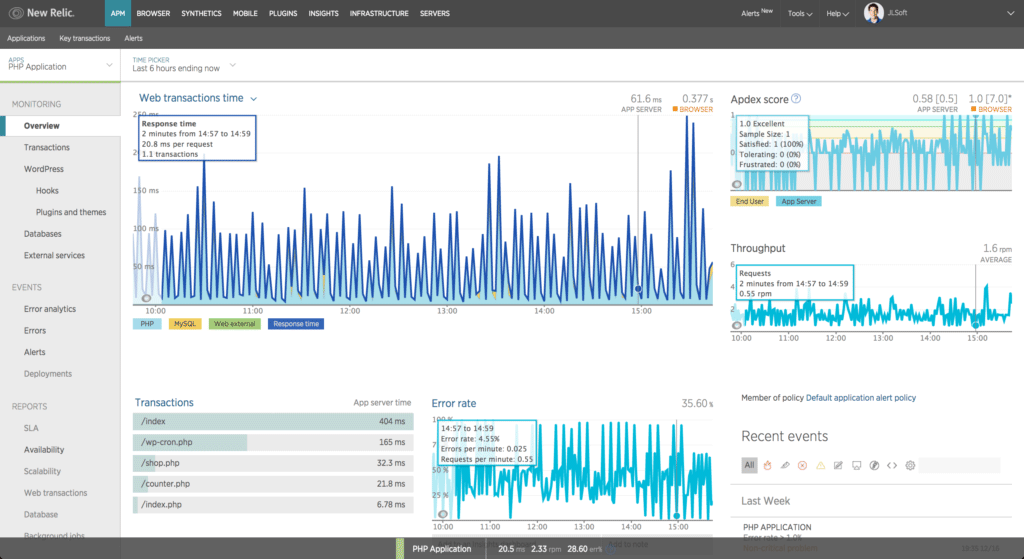
New Relic is an Application Performance Management (APM) tool that can be used to monitor website performance for various metrics. It offers a range of reports and features to help identify and resolve issues that may be slowing down a website.
The New Relic APM dashboard includes tabs for different reports, including a WordPress-specific tab that provides an in-depth overview of activity related to WordPress plugins, themes, and external resources.
Database monitoring is also available in New Relic, which can help identify and analyze database behavior and query efficiency. The Service Level Agreement (SLA) report shows how well the website performed within a specific time frame, allowing for comparisons and optimizations during peak hours.
Overall, New Relic is a powerful WordPress site performance test tool for teams that prioritize website performance and want to quickly identify and resolve any issues in real-time.
How to run a WordPress speed test and measure loading time and performance
To ensure an accurate and efficient WordPress speed test, it’s important to keep some recommended settings and testing principles in mind. First and foremost, always test multiple times to account for any anomalies that could mislead you. Additionally, tests from different locations account for varying contexts and circumstances. It’s also crucial to make sure that your website caching is turned on and that your Content Delivery Network (CDN) is running to optimize global content delivery. Lastly, don’t forget to test from a mobile perspective as the majority of website traffic now comes from mobile devices.
Once you have these factors in check, you can proceed with running a speed test on your WordPress site. For best results, use a tool like WP Rocket for caching management and RocketCDN for optimizing your CDN. Finally, be sure to test both desktop and mobile versions of your site as they can perform differently.
What to do if you encounter an error?
In case you encounter an error message while running your WordPress site performance test, there are a few things you can check to troubleshoot the issue. First, ensure that you have entered the correct URL in the text box, without any spelling errors. Make sure to use “https” instead of “http”. Check if any firewall settings are blocking the test, depending on your location. Confirm that your site is published by your hosting service and that the tool you are using is functioning properly. If you have followed these steps and still have issues, contact the customer support team of the tool for further assistance.
Additionally, if a tool detects errors, such as downtime on your website, it’s recommended to monitor your website. For instance, you can use Pingdom to receive instant alerts before your customers notice any issues.
How to Optimize Your WordPress Website Based on the Performance Test Results
You now know how to run a WordPress performance test. But what you are going to do with the results?
Optimizing your WordPress website based on the performance test results is essential to ensure that your website runs smoothly, loads quickly, and provides a positive user experience. Here are some steps you can take to optimize your WordPress website based on the performance test results:
- Analyze the performance test results: Start by analyzing the performance test results to identify any areas that need improvement. Look for metrics such as load time, page size, number of requests, and time to first byte to identify areas of concern.
- Optimize images: Large image files can slow down your website’s load time, so it’s important to optimize them for the web. You can use tools like Smush or EWWW Image Optimizer to compress and optimize your images without compromising their quality.
- Minimize HTTP requests: The more HTTP requests your website has to make, the longer it will take to load. You can reduce the number of HTTP requests by minimizing the number of images, scripts, and stylesheets on your website.
- Use a caching plugin: A caching plugin can significantly improve your website’s load time by storing frequently accessed data in the cache, reducing the number of database queries required to generate a page. Popular caching plugins include WP Super Cache and W3 Total Cache.
- Optimize your database: Over time, your WordPress database can become cluttered with unnecessary data, which can slow down your website. Use a plugin like WP-Optimize to clean up your database and remove any unnecessary data.
- Use a content delivery network (CDN): A CDN can help improve your website’s load time by distributing content across multiple servers, reducing the distance between the user and the server. Cloudflare and Amazon CloudFront are popular CDNs.
- Use a fast and reliable web hosting provider: Your web hosting provider can have a significant impact on your website’s performance. Choose a fast and reliable provider, and consider using a managed WordPress hosting service for optimal performance.
By following these steps, you can optimize your WordPress website based on the performance test results and provide a fast and responsive user experience for your visitors.
Conclusion
It’s important to keep your website’s performance in check because slow loading times can lead to a decrease in visitors. To achieve this, it’s recommended to use a combination of WordPress site performance test tools to get a complete understanding of your website’s performance.
Pingdom Tools can be used to measure your website’s loading times. Google PageSpeed Insights is helpful in analyzing your website’s current optimization, and Load Impact can be used to stress test your website. By using all three tools, you can get a comprehensive overview of your website’s performance.
Add your first comment to this post